 Gusset
Documentation › Reading results
Reading results
What each plot shows, how to read the legend, and which numbers to trust.
What is plotted
The Plot group of the Results tab chooses what is drawn. A click on a button shows the plot you last looked at; the arrow beside it lists the others.
| Button | Plots | Tells you |
|---|---|---|
| Stress | von Mises stress; max principal stress. For layered materials also stress across the layers and shear between them. | Where the material works hardest. von Mises is the one to compare with yield in metals. |
| Displace | Displacement: its size, or along X, Y or Z. | How far the model moves, in mm. |
| Safety | Factor of safety. | Yield strength ÷ stress. Below 1, the part would yield there. |
| Modes | Buckling modes and vibration modes, when you asked for them. | See Buckling and natural frequencies. |
Right-clicking the view offers the same plots. Model and Results in the Mode group switch between the plain model, ready to edit, and the results. If you change the setup after solving, the Results tab shows that the results are out of date until you solve again.
The legend
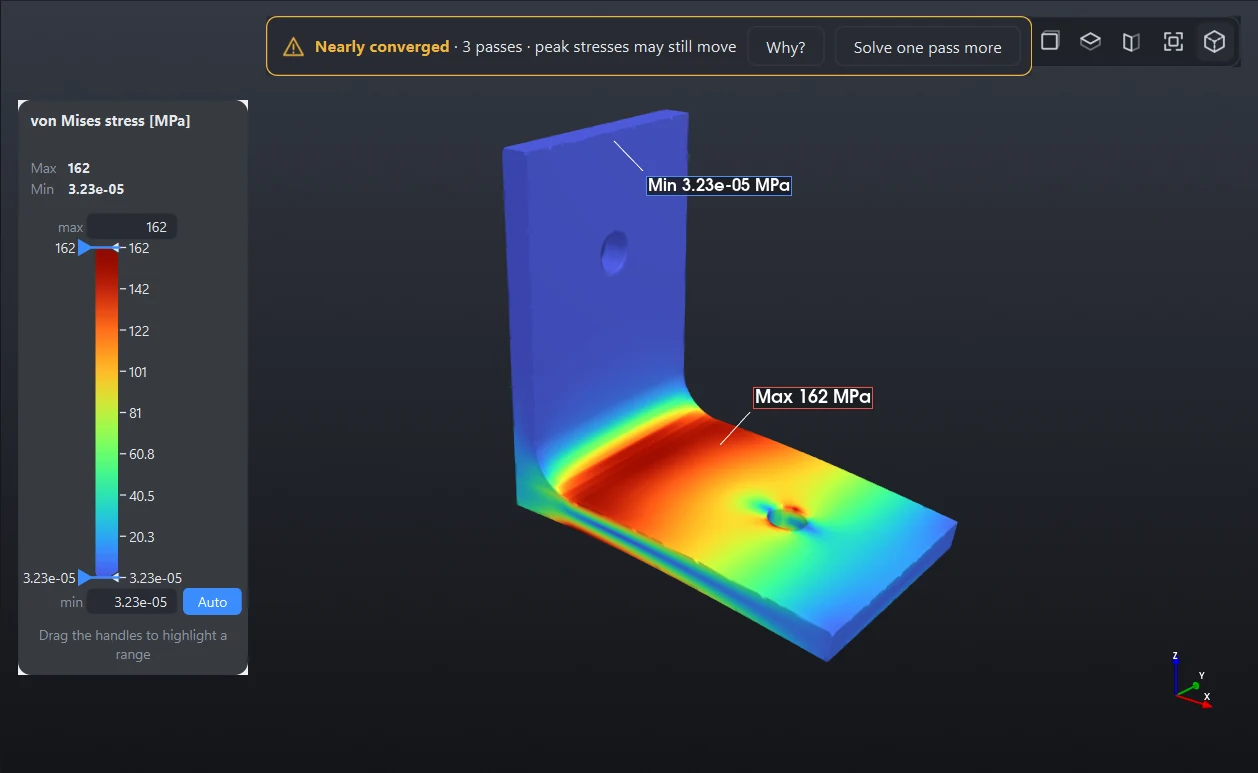
- Set the range. Type in the boxes at the top and bottom of the colour bar. Each kind of plot keeps its own range. Auto returns to the range of the data.
- Show only what matters. The colour bar has two handles. Values above the top handle turn light grey and values below the bottom one dark grey. On a factor of safety plot, drag the top handle to 1.5 to see only the areas below 1.5. The legend says what share of the surface is in range. Double-click resets it.
- Banded colours colours in steps instead of smoothly.
Set the top of a stress legend to the yield strength, or to your allowable stress. One small peak otherwise stretches the scale until the rest of the model is a single colour.
Deformation
The model is drawn deformed, with the movement multiplied so that you can see it. The Deformation group sets the factor: Undeformed, Automatic, True scale, ×10, ×100, ×1000, or any number typed beside it.
Animate plays the loading from nothing to the full load and back, with the colours following. Watching it is the quickest way to see whether the model moves as the real thing would. A part that swings the wrong way usually means a fixture or a joint is not what you meant.
Reading values
- Probe: click the model to read the value at that point. The labels stay, and go into the report. Clear removes them.
- Min/Max: pointers at the largest and smallest value of what is plotted, among the parts shown.
- Summary: a table under the view. The Parts tab has each part's material, mass, largest displacement, largest von Mises stress, lowest factor of safety and a note. Click a heading to sort by it; double-click a part to show only that part. Welds, Bolts and Joints have tabs of their own when the model has them (Joints).
Factor of safety
The factor of safety is the material's yield strength divided by the von Mises stress, part by part. What is high enough is for you and the code you work to. It covers yielding under this load only: it says nothing about fatigue, buckling, or a load you did not apply.
For 3D prints and other layered materials it is the lower of two checks, one within the layers and one on the bond between them. The table says when the bond governs.
Peaks you should not believe
An elastic analysis gives an endless stress at a perfectly sharp inside corner. The finer the model, the higher that number climbs, without limit. It is not real: a real corner has a radius, and real metal yields a little.
- Weld roots and toes. Where two welded parts meet there is a sharp corner. Gusset flags a part whose peak sits at a weld root in the Note column. Judge the weld by its throat stress, and the part by the stress a little way from the joint.
- Sharp inside corners in the CAD. If the real part has a fillet there, model the fillet. The stress at a modelled fillet or hole is real and does settle.
- The edge of a fixed face. See Fixtures.
A peak that keeps rising from pass to pass at a sharp corner is this. A peak at a hole or fillet that settles as passes are added is real.
Does it make sense?
- Is the verdict Converged, or near enough for what you need?
- Does the animation move the way the real thing would?
- Is the largest displacement the size you would expect, and small beside the size of the model? A displacement that is large beside the part means the answer is beyond what a linear analysis can give.
- Do the reactions in the report match the loads?
- Is the peak stress somewhere it should be, and not at a sharp corner or the edge of a fixture?
Anything safety-critical should be checked independently by a qualified engineer.
Something wrong or missing on this page? Tell us.